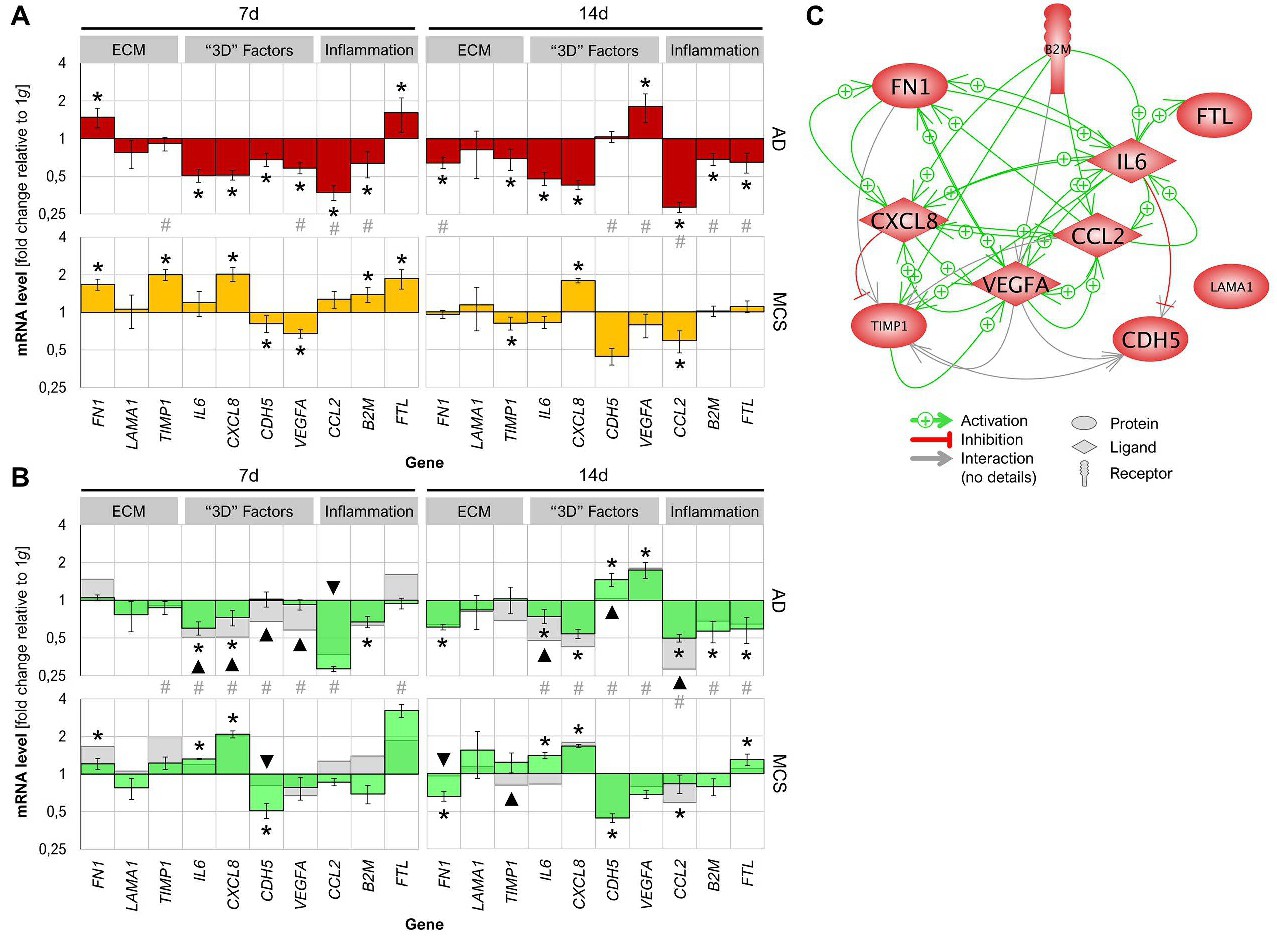
Fig. 5. Effects of s-µg on the gene expression of EA.hy926 cells. A) Changes of mRNA levels after exposure to the RPM. Fold changes of AD cells are shown in red, fold changes of MCS are shown in yellow B) Changes of mRNA levels after VEGF supplementation (green bars) compared to samples without additional VEGF (grey bars). C) Mutual interaction of selected genes at gene expression level. We selected 10 genes, whose up- or down-regulation were analysed by qPCR after 14 d culturing on the RPM. The green arrows indicate activating and the red one inhibiting effects. The interaction network was built up using Elsevier Pathway Studio v.11. * P <0.05 vs. 1g control; # P <0.05 AD vs. MCS; ▼|▲ P <0.05 vs. −VEGF.